Learn how to optimize your Instagram ad conversion rate, and benchmark average CVR

Will Park
Feb 12, 2024

If you’re reading this blog post, chances are high that everyone you know has an Instagram account. It’s no surprise that Instagram has evolved into one of the most performant advertising channels for marketers to build awareness with, nurture, and convert their audience. But what if your Instagram ad conversion rates are too low, or worse, unprofitable?
Well, it just so happens that we’re here to talk about how to improve your instagram ad conversion rates!
Let's dive into what conversion rate (CVR) means, the impact of your conversion rate on your business, how to diagnose your Instagram ad performance, and some simple steps to help you increase your Instagram ad’s conversion rate.
What is a conversion?
At its core, a “conversion” is the holy grail of digital marketing — a user action that aligns with your campaign's goal, be it a purchase, link click, or sign-up.
Your Instagram ad conversion rate, measures the percentage of users who complete this desired action after clicking on your ad. For those of you more mathematically inclined, you can calculate your conversion rate with this simple formula:
Conversion rate (percentage) = Results ÷ Total clicks x 100
Got it? Let’s diagnose your funnel performance.
Diagnose your Instagram ad’s performance
Our goal here will be to understand how well your users are moving through the funnel (from putting eyeballs on your ad > clicking to the landing page > completing a desired conversion) to confirm that your conversion event is the issue.
Let’s start at the top of the funnel and work our way down. We’ll start with CPM, then CTR, and finally CVR.
CPM and impressions: The visibility quotient
Cost Per Mille (CPM) measures how much you pay to get your Instagram ad see. CPM is calculated as the cost per 1,000 impressions, and is a vital metric to gauge your Instagram ad exposure.
The lower your CPM, the better your Instagram ad is performing at the tippy-top of the funnel. Better CPMs also indicate quality ads, due to “ad relevance diagnostics”. We discuss CPM and ad relevance diagnostics at length here.
Calculating CPM is straightforward:
CPM = (Ad spend ÷ Number of impressions) × 100
Benchmarks for CPM
Understanding the average CPM for Instagram ads is not a straightforward task. CPM costs can vary by campaign objective, industry, time of year, and economic factors. For example, RevealBot’s data shows that the average CPM for for Instagram ads in January 2024 was $8.80. But, the average for web traffic campaigns was $2.12.
How to find your Instagram ad CPM
Your Instagram ad account provides detailed insights into your CPM and impressions. Keeping an eye on these figures helps assess your ad's visibility.
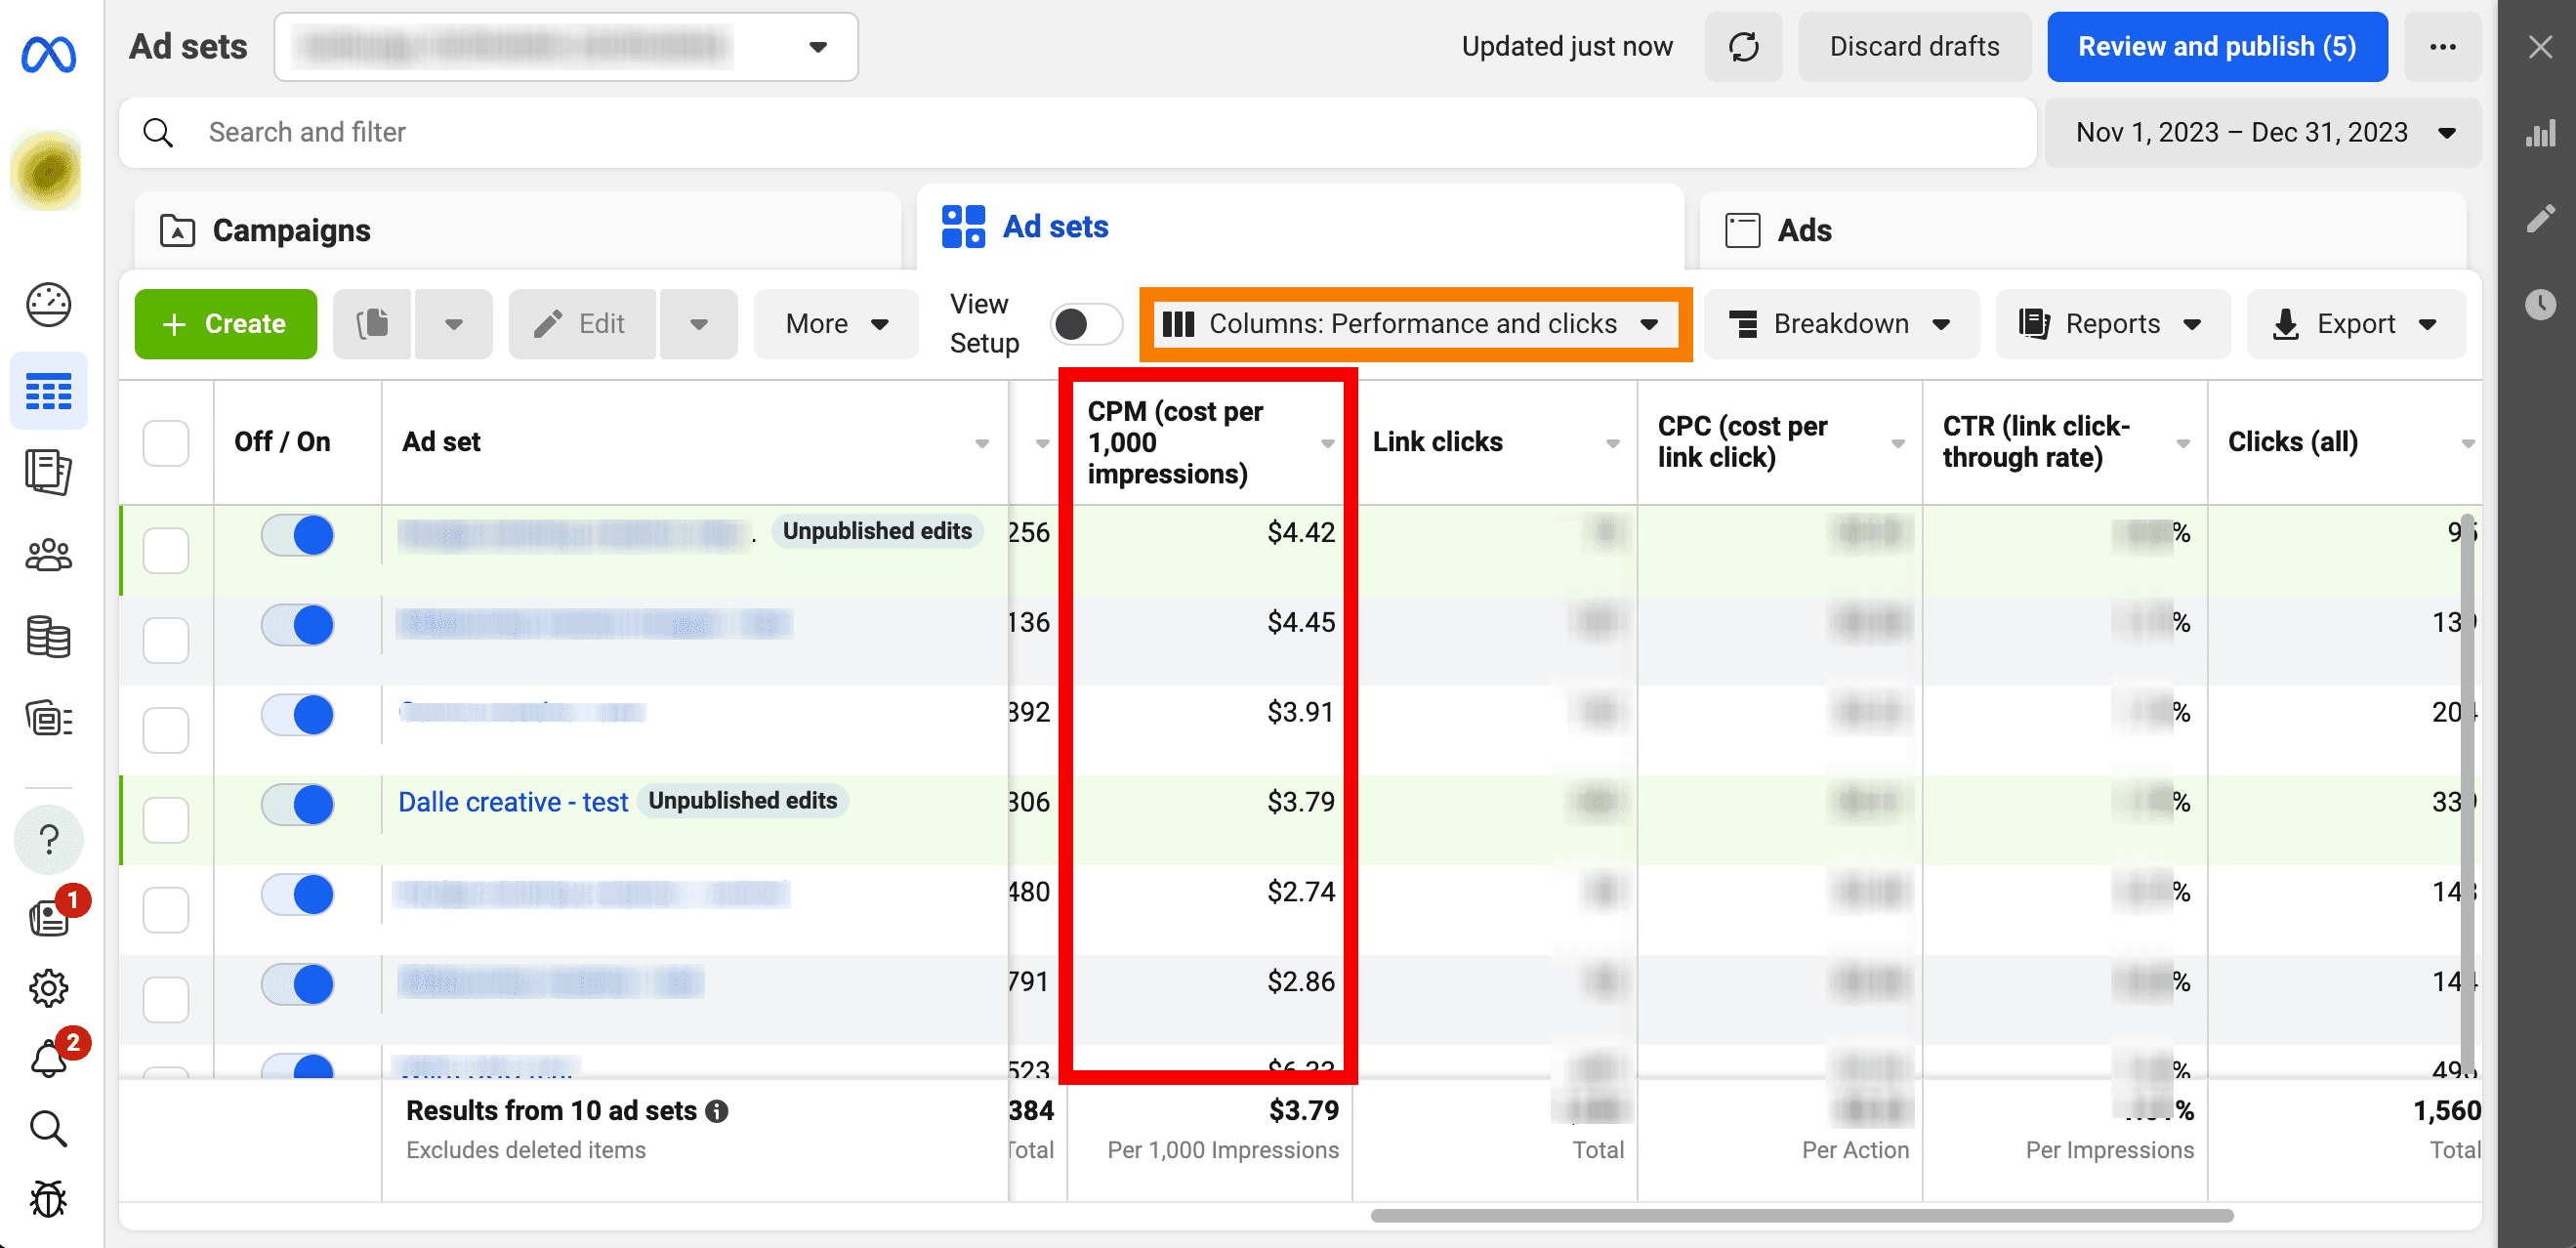
You can find your ad costs inside the Meta/Facebook Ads Manager. Click through to your desired campaign or ad set, arrange your columns to the “Performance” preset (the orange box in the screenshot below), then scroll over to the CPM column.
This is what it should look like:
Resources for CPM benchmarks
See how your Instagram ad costs stack up to industry, campaign, or competitor averages.
Is your Instagram ad CPM healthy?
If your CPM is significantly higher than average, your ad CPM is definitely not healthy. Before continuing with this guide, consider optimizing your CPM costs using our Facebook ad CPM optimization guide.
Fix your Instagram ad CPM costs
But, if your Instagram ad costs are around (or below) average benchmarks for your industry or campaign, that’s great! Your top-of-funnel performance is healthy, and is not a problem.
For those of you in the latter group, let’s move further down the funnel to diagnose your Click-Through Rate (CTR).
CTR: The interest indicator
Click-Through Rate (CTR) measures the percentage of impressions that led to a click. It's a direct indicator of how engaging your ad is.
Remember, the better your ad CTR, the better your ad relevance diagnostic metrics. And we know that better ad relevance diagnostics leads to better ad performance overall with
Calculate CTR by dividing the number of clicks by the number of impressions, then multiply by 100.
CTR = (Total clicks on ad ÷ Number of impressions) × 100
Benchmarks for CTR
A healthy CTR means your ad is not just seen, but also compelling enough to generate engagement (clicks, in this case). As with CPM, the benchmarks for CTR are fairly diverse, and vary greatly depending on the industry.
The Instagram ad CTR average for January 2024 was 0.9%, according to FilipKonecny. This means that for every 1,000 people that sees your ad, about 9 of them will click on the ad.
Again, this benchmark is highly dependent on your industry. For example, the food & beverage industry saw an average CTR of 0.6%, while the fashion industry saw 1.2% (that’s twice as high!).
How to find your CTR
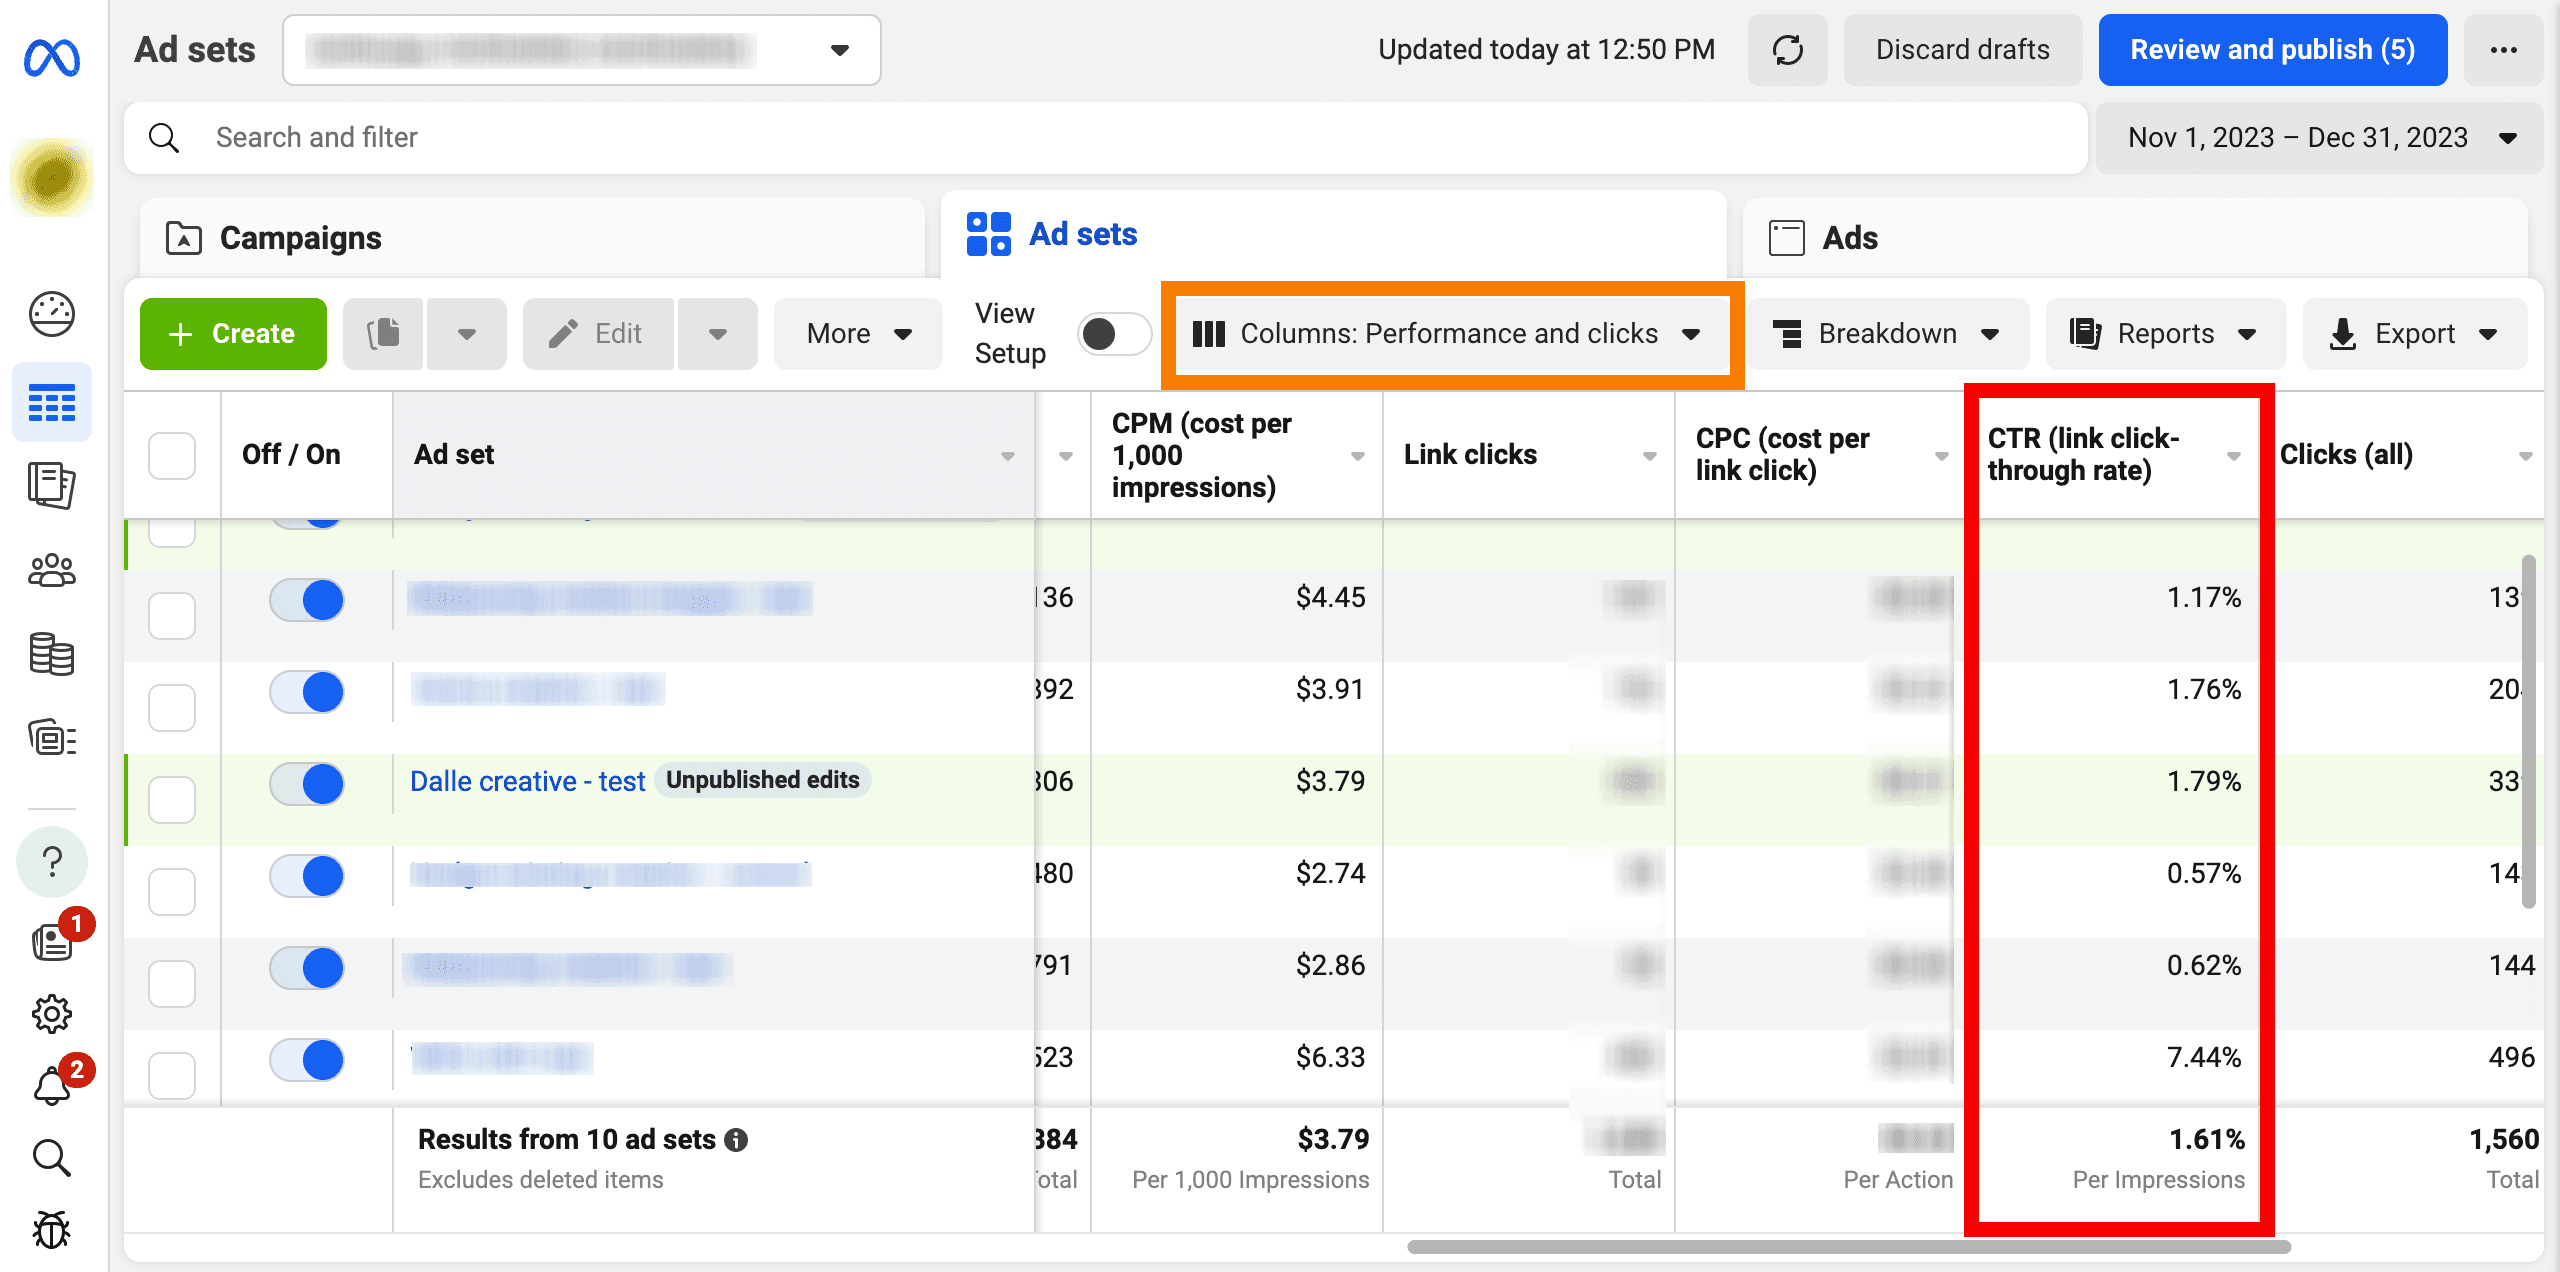
To find your Instagram ad CTR, just head over to your Facebook Ads Manager and navigate to your desired campaign.
Once there, ensure your columns are configured to the “Performance” preset (orange box in the screenshot below). Then, scroll over to CTR.
Resources for CTR benchmarks
See how your click-through rate measures up against benchmark averages.
How does your Instagram ad stack up?
Now that you know how to compare your Instagram ad CTR against benchmarks, it’s time for some introspection.
Ask yourself, “are my ad CTRs performing as well as they should be?”. If your ad CTR is lower than your industry average, or just the overall average on Instagram, it’s time to hit the brakes. Before you look into your CVR, you’ll want to fix your CTRs. It’s all about improving your “ad relevance diagnostic” metrics, and we show you just how to do that here.
Improve Instagram ad CTR with better ad relevance
For those of you with Instagram ads that are generating clicks at (or better) than average, here’s a high-five for a job well done! ✋
At this point, we’ve analyzed your CPM and CTR. If you don’t see any performance issues, it’s time to move to our final diagnostic step.
CVR: The final destination
Because no business can survive on clicks and likes alone, we consider conversion to be the most important part of your funnel. It’s the only part of your funnel that directly impacts your profits and should be the final destination for all clicks on your Instagram ad.
We’ve already covered what CVR means, and how to calculate it. So, let’s jump right into finding your CVR on Ads Manager, then benchmarking your Instagram CVR.
Benchmarks for conversion rate on Instagram
CVR benchmarks on Instagram can vary widely by campaign objective and industry. A study from Shopify shows that the average CVR across all industries and campaign objectives was 1.08%. However, conversion rates for e-commerce ads was nearly 3%.
That’s a pretty wide range, so we encourage you to dig a bit deeper to understand the CVR average that makes the most sense for your business.
How to find your conversion rate?
You can find your Instagram ad conversion rate through the Facebook Ads Manager. Simply log into Ads Manager, then click into the Campaign → Ad Set → Ad you would like to analyze. Then, make sure to load up the “Performance” column template (orange box in the screenshot below).
For the purposes of this article, we have customized this view so that the “Results” and “Link clicks” columns are next to each other.
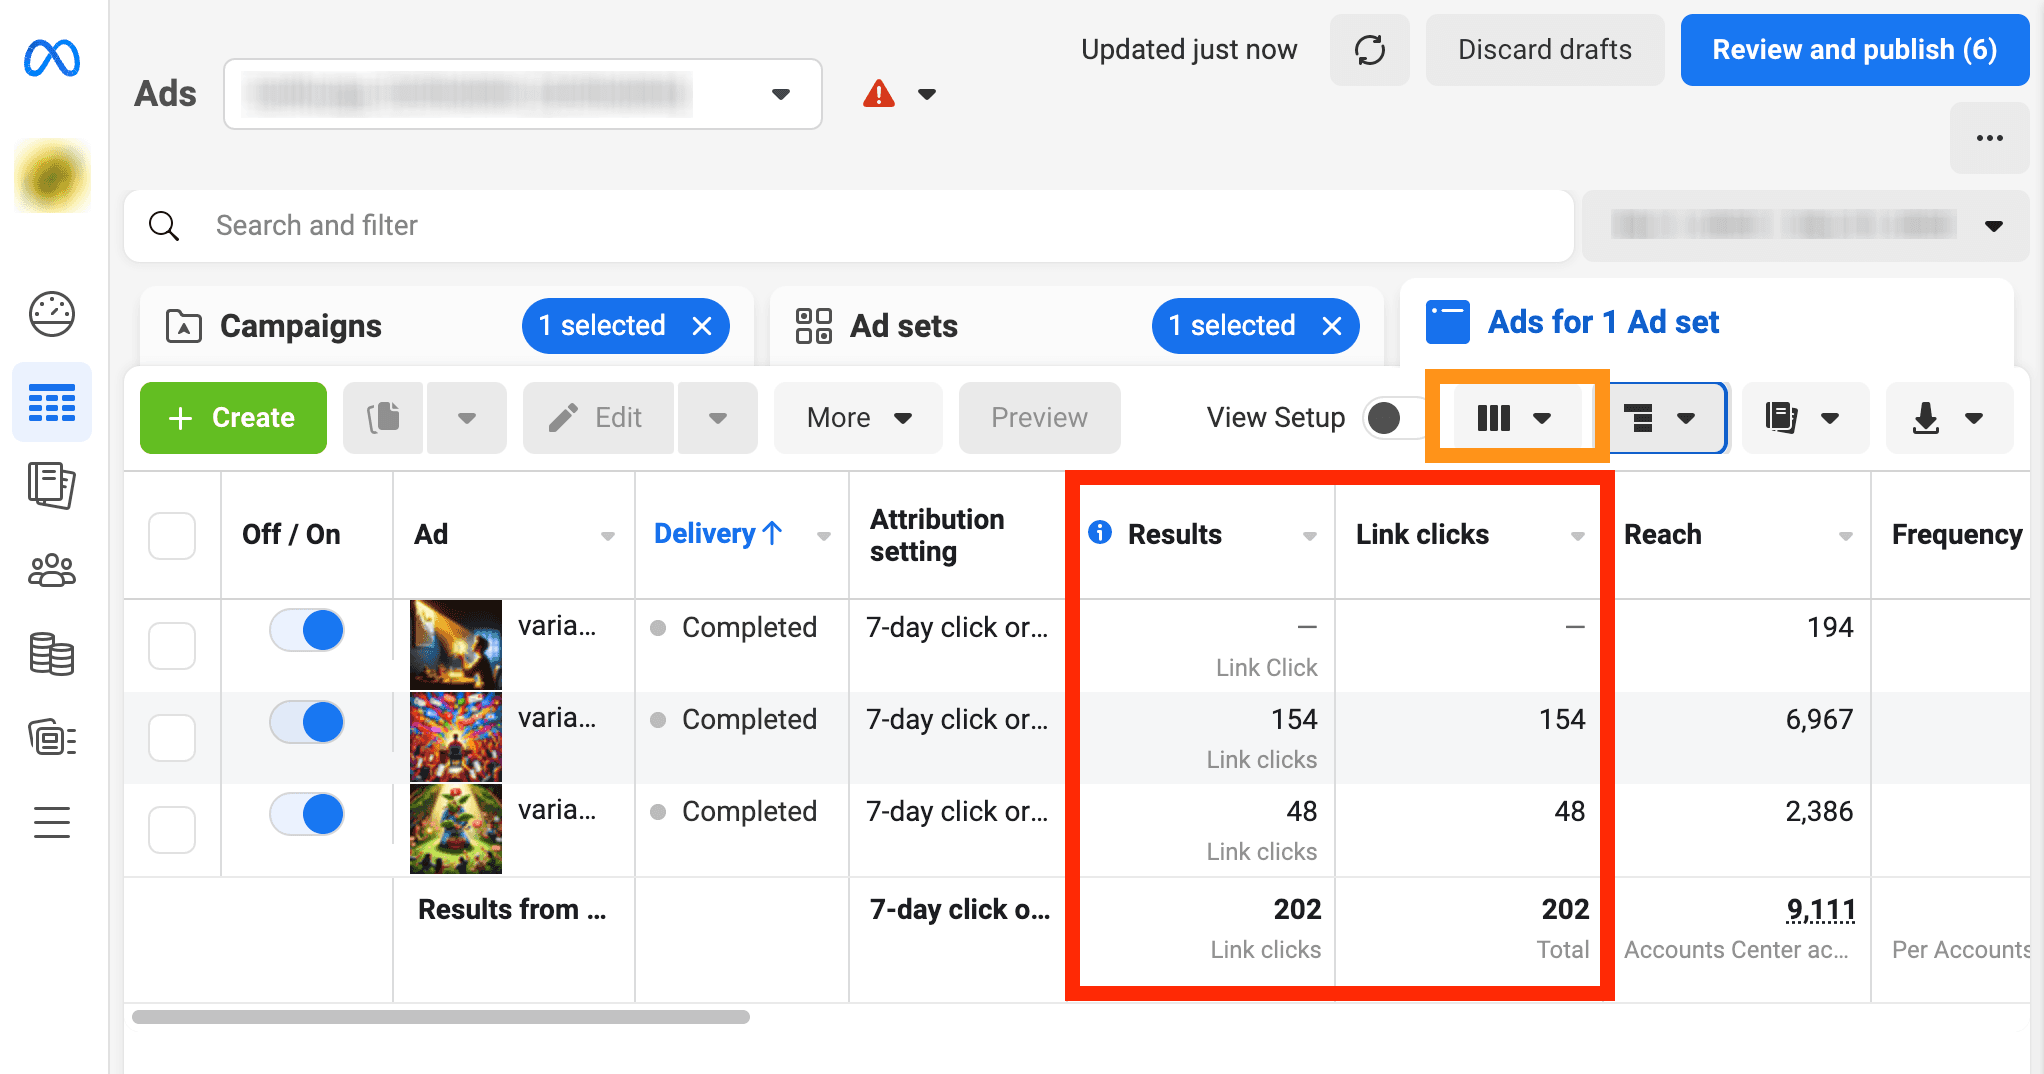
Keep in mind, you can use this same process to calculate your conversion rate at the Ad Set and Campaign levels as well, depending on how many ad variants you have per Ad Set or how many Ad Sets you have per Campaign.
Resources for CVR benchmarks
Can we confirm that your Instagram ad is experiencing conversion friction?
If your CVR is low despite healthy CPM and CTR figures, it's time to scrutinize your ad creatives, messaging, call-to-action, and landing page.
But wait, you ask. Why are we talking about landing page when I’m concerned about my Instagram ad’s performance? Often, the issue lies not in the ad itself but in the post-click experience, which is another way of saying “your landing page experience”.
Let’s take a step-by-step approach that starts with tweaks to your ad creatives and ends with landing page optimizations that boost conversions (and profits!).
6 steps to improve your Instagram ad CVR

Optimizing your Instagram ad conversion rate isn't black magic. It’s just a matter of executing on a straightforward strategy to help you turn casual visitors into customers. Here are some tips to help you get more conversions:
1. Move your conversion objective higher in the funnel
This is perhaps the lowest of hanging fruits in terms of conversion rate optimization. Try changing your Instagram ad campaign objective to a broader, higher-funnel action. By focusing on broader objectives like “Link clicks” or “Traffic”, you'll quickly see better conversion rates.
To do this, open Facebook Ads Manager and click “Edit” under your desired “Campaign”. Then select an upper-funnel campaign objective on the details panel.
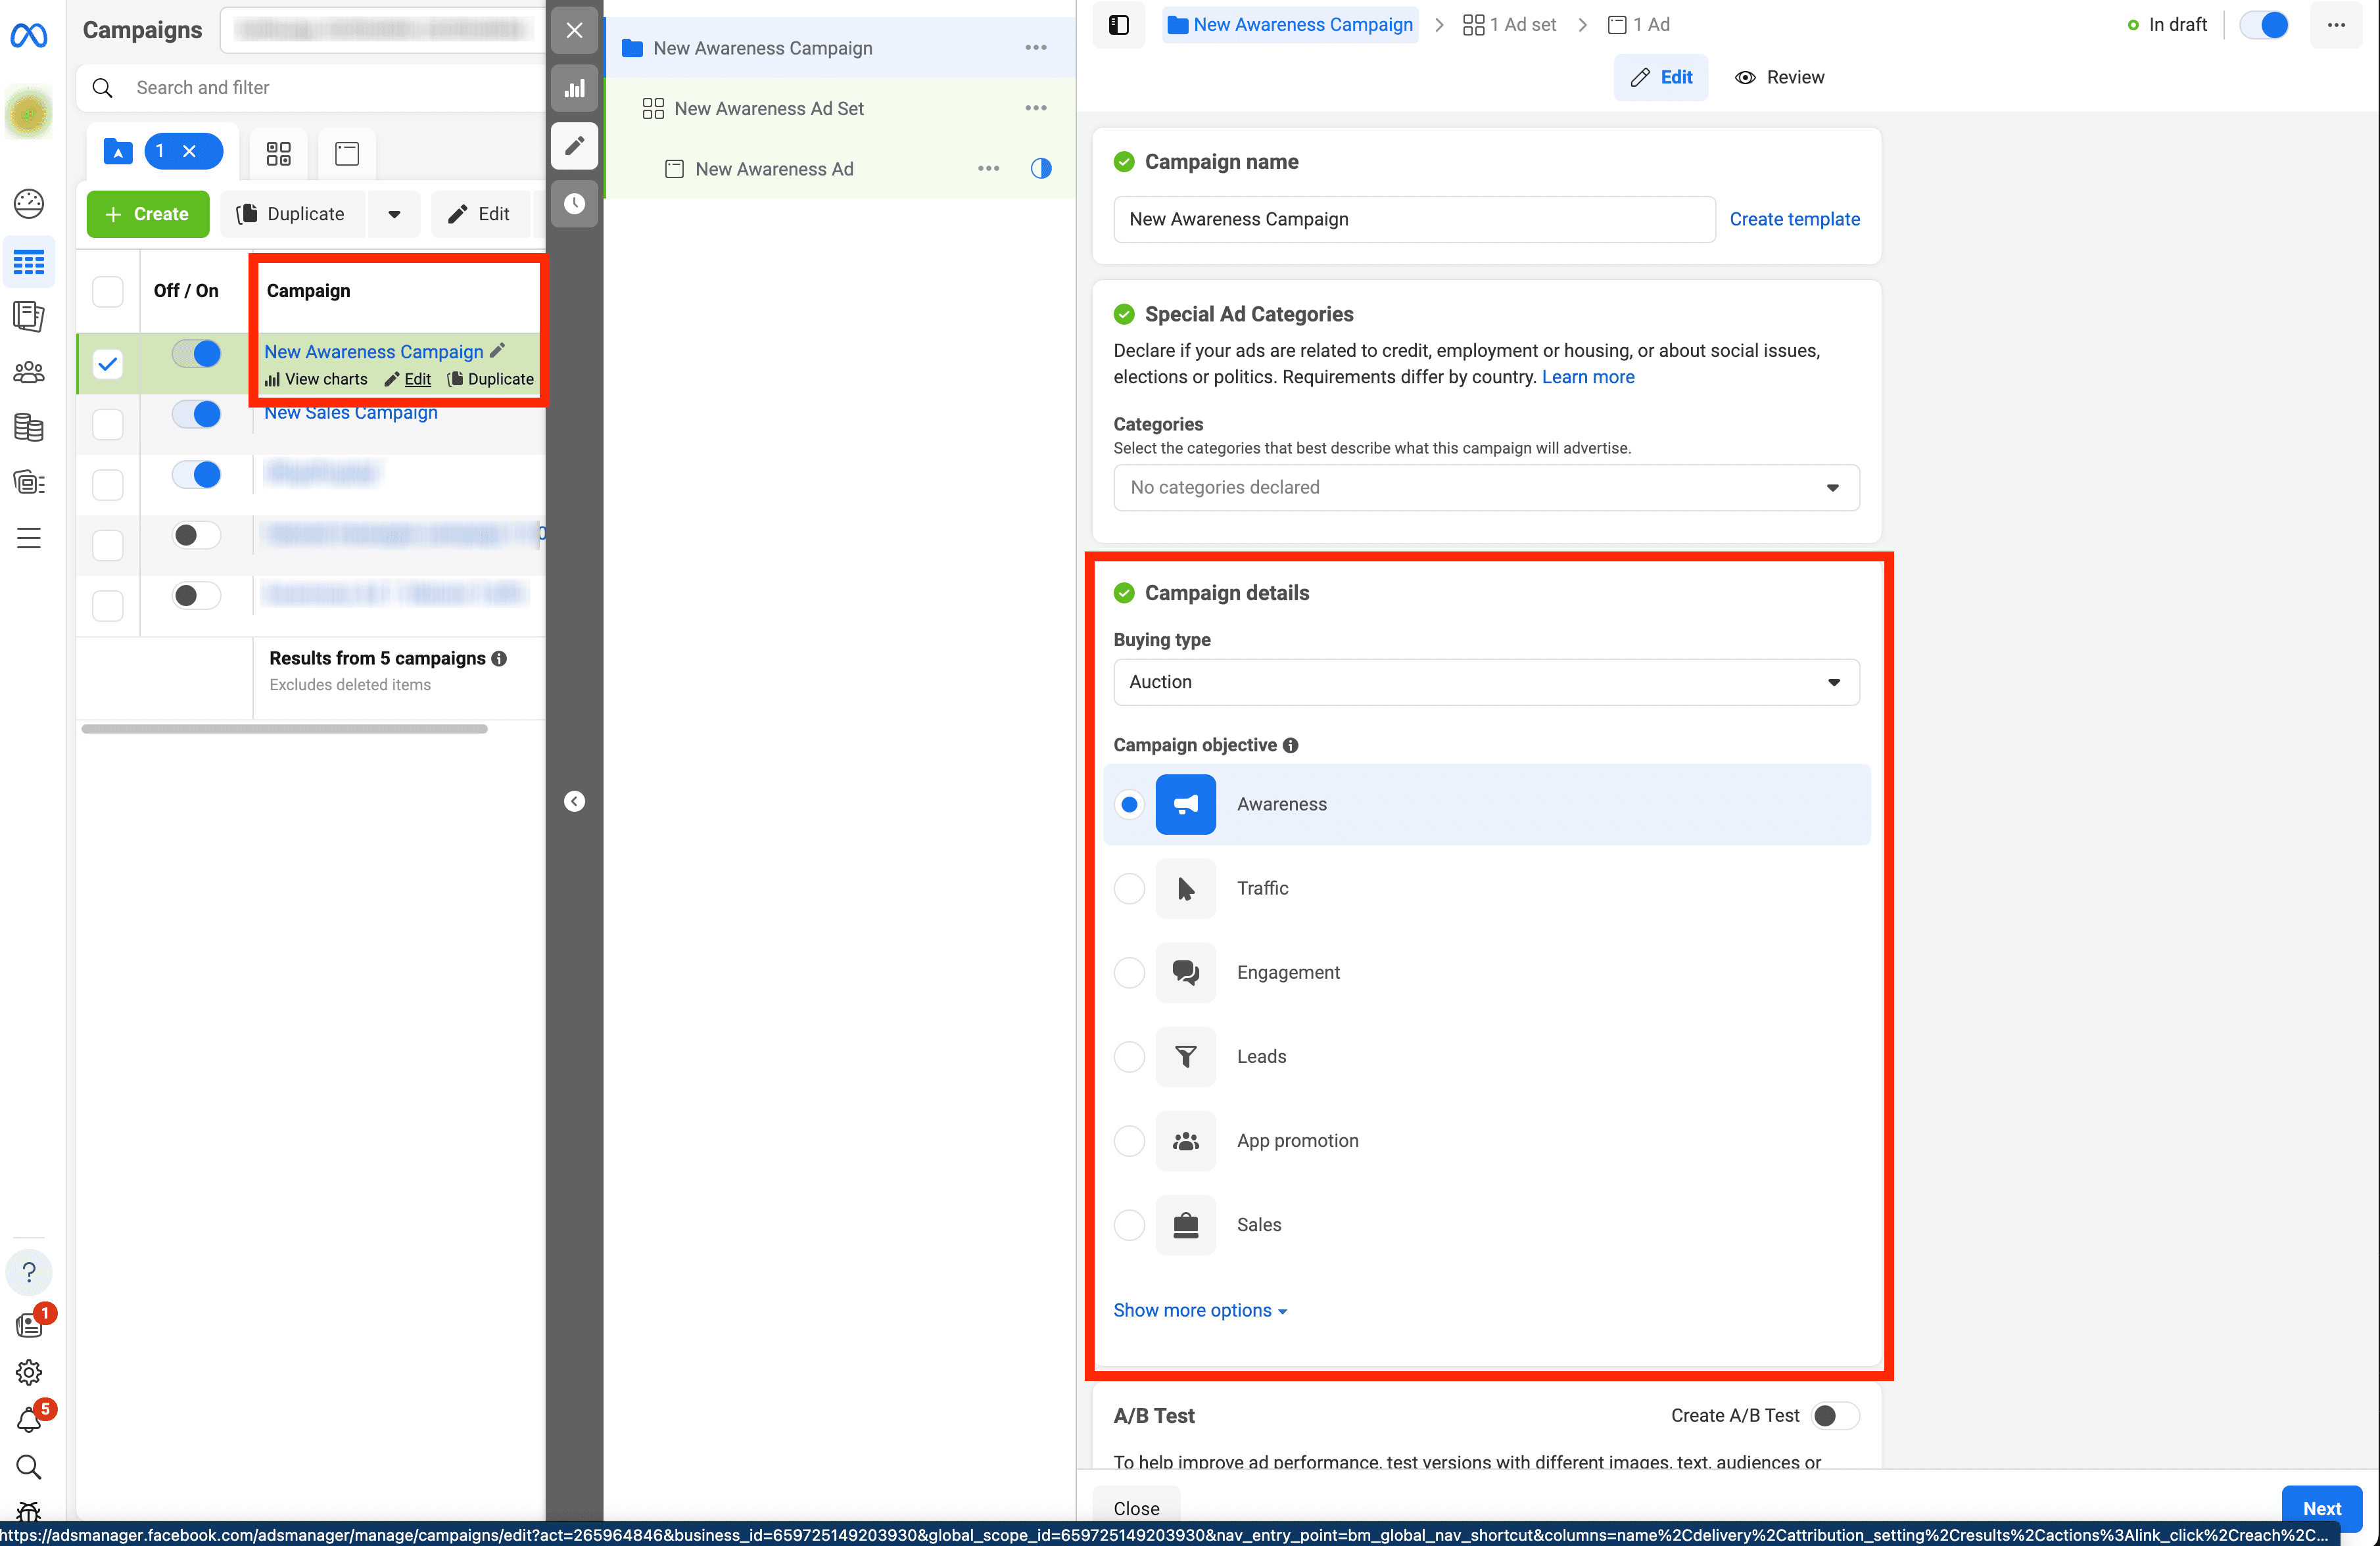
By building a foundation of potential customers primed for deeper funnel conversions, optimizing for upper funnel conversions will set you up for future success.
But, and this is a big one, optimizing at this end of the funnel can result in fewer users completing your desired conversion. You might see many more website visitors, but fewer overall purchases. In this scenario, you have optimized your conversion rate, but have sacrificed ROAS and profits.
2. Instagram Shopping Ads are worth a try
Have you ever seen those Instagram posts or ads with clickable overlay buttons on the image that take you directly to a product page? Those buttons are called “Product Tags”, and are enabled by a feature called “Instagram Shopping”, and they can be applied to both organic posts and ads.
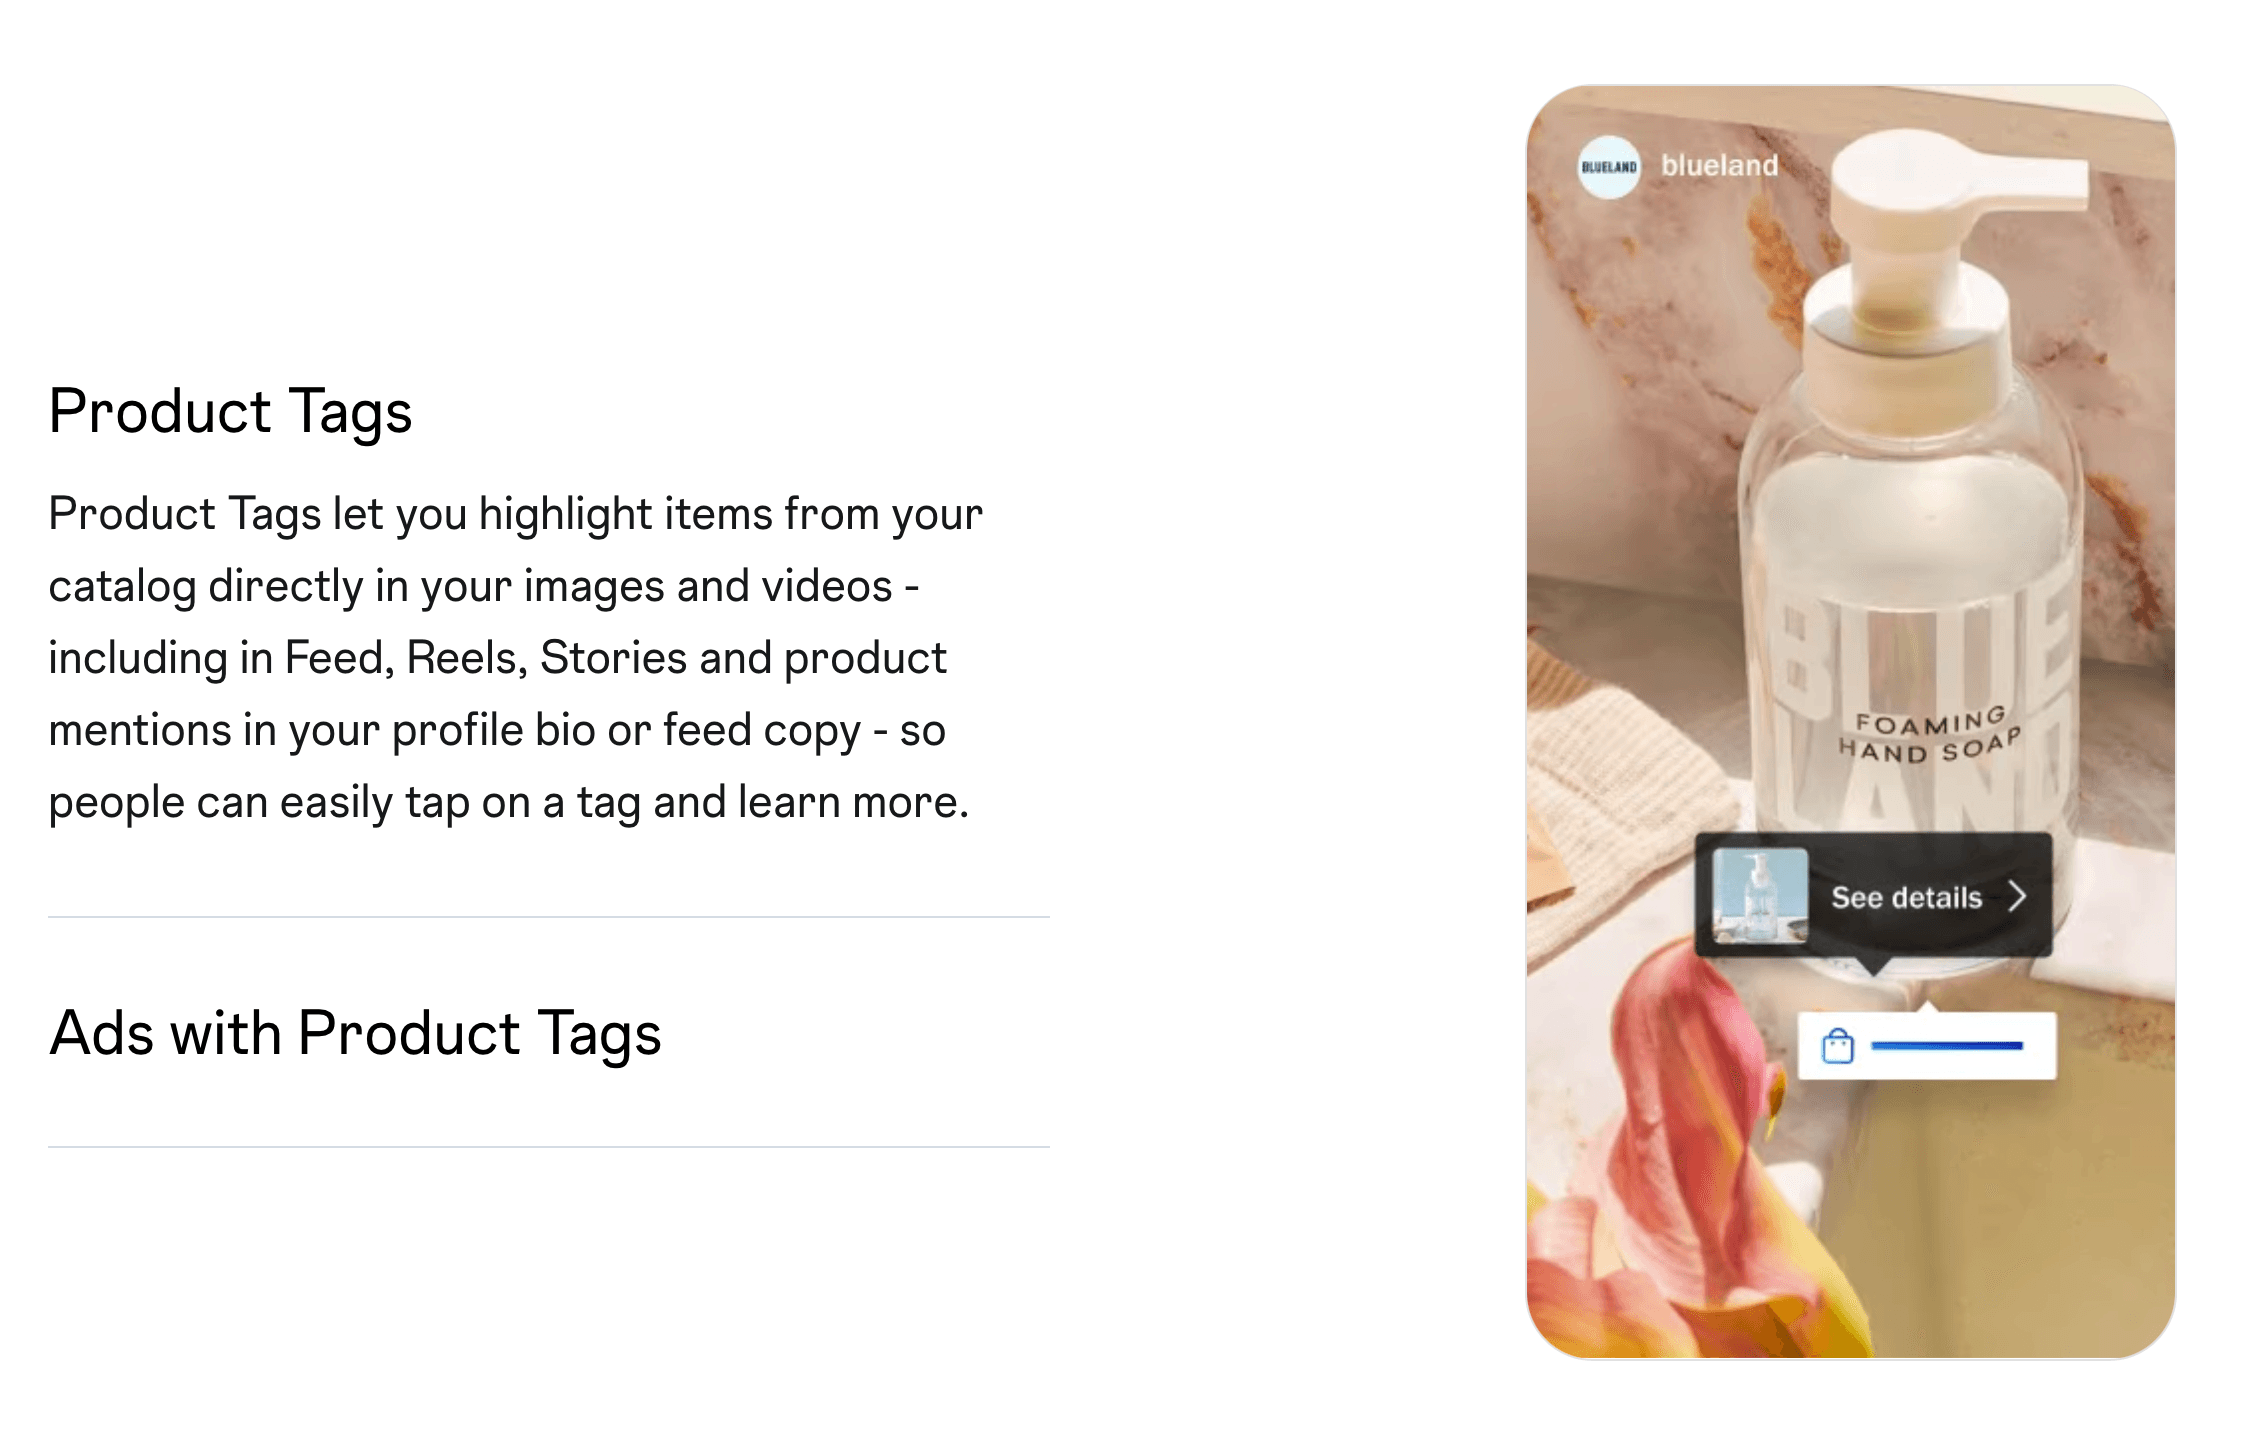
CleverZebo found that posts with Instagram Shopping buttons generate 42% more sales. That means 42% more conversions!
Using Instagram Shopping on your Instagram ads does require a bit of setup (mostly to configure your Shopping store and upload your product catalog), but we highly suggest you bite the bullet and give it a try.
3. Try changing your ad placement
User behavior is a funny thing. Case in point: did you know that Instagram ads exhibit different conversion rates, depending on where the ad is shown?
Instagram allows ads to be placed in the Feed as well as in Stories. These are two different “ad placements”, and they can impact your CVR.
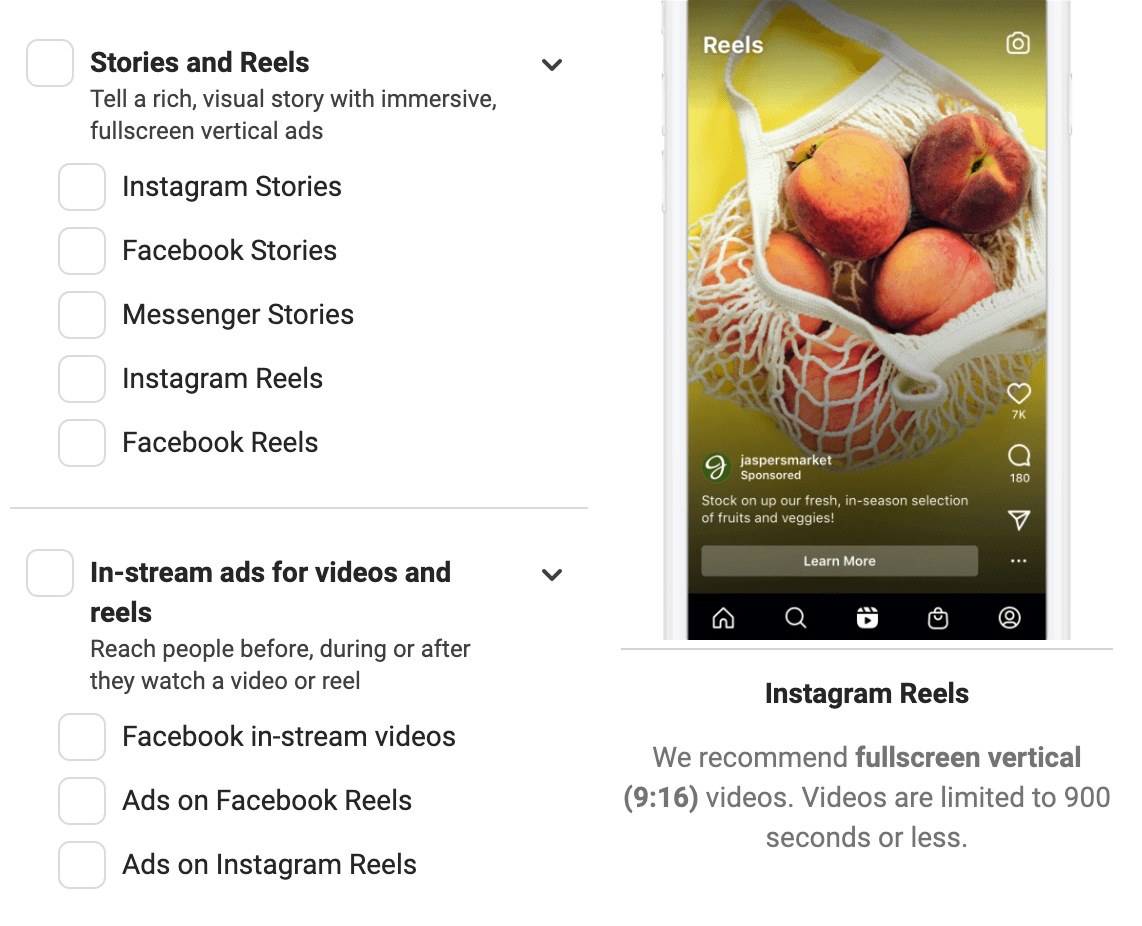
According to Brafton, Instagram ads in the Feed show click-through rates that range between 0.22% and 0.88%. Stories placements result in CTR that ranges between 0.33% and 0.54%. While there isn’t any placement-specific data on conversion rates, we do see ad performance differences for both CTR and CPC (Cost Per Click). Given this observation, we can infer that placements will also affect your CVR.
The key takeaway here is that Feed placements have the potential to drive more conversions, but Stories placement might perform better in some scenarios.
Our suggestion is to try expanding your Instagram ad placements to include Stories.
4. Optimize your ad creatives for engagement
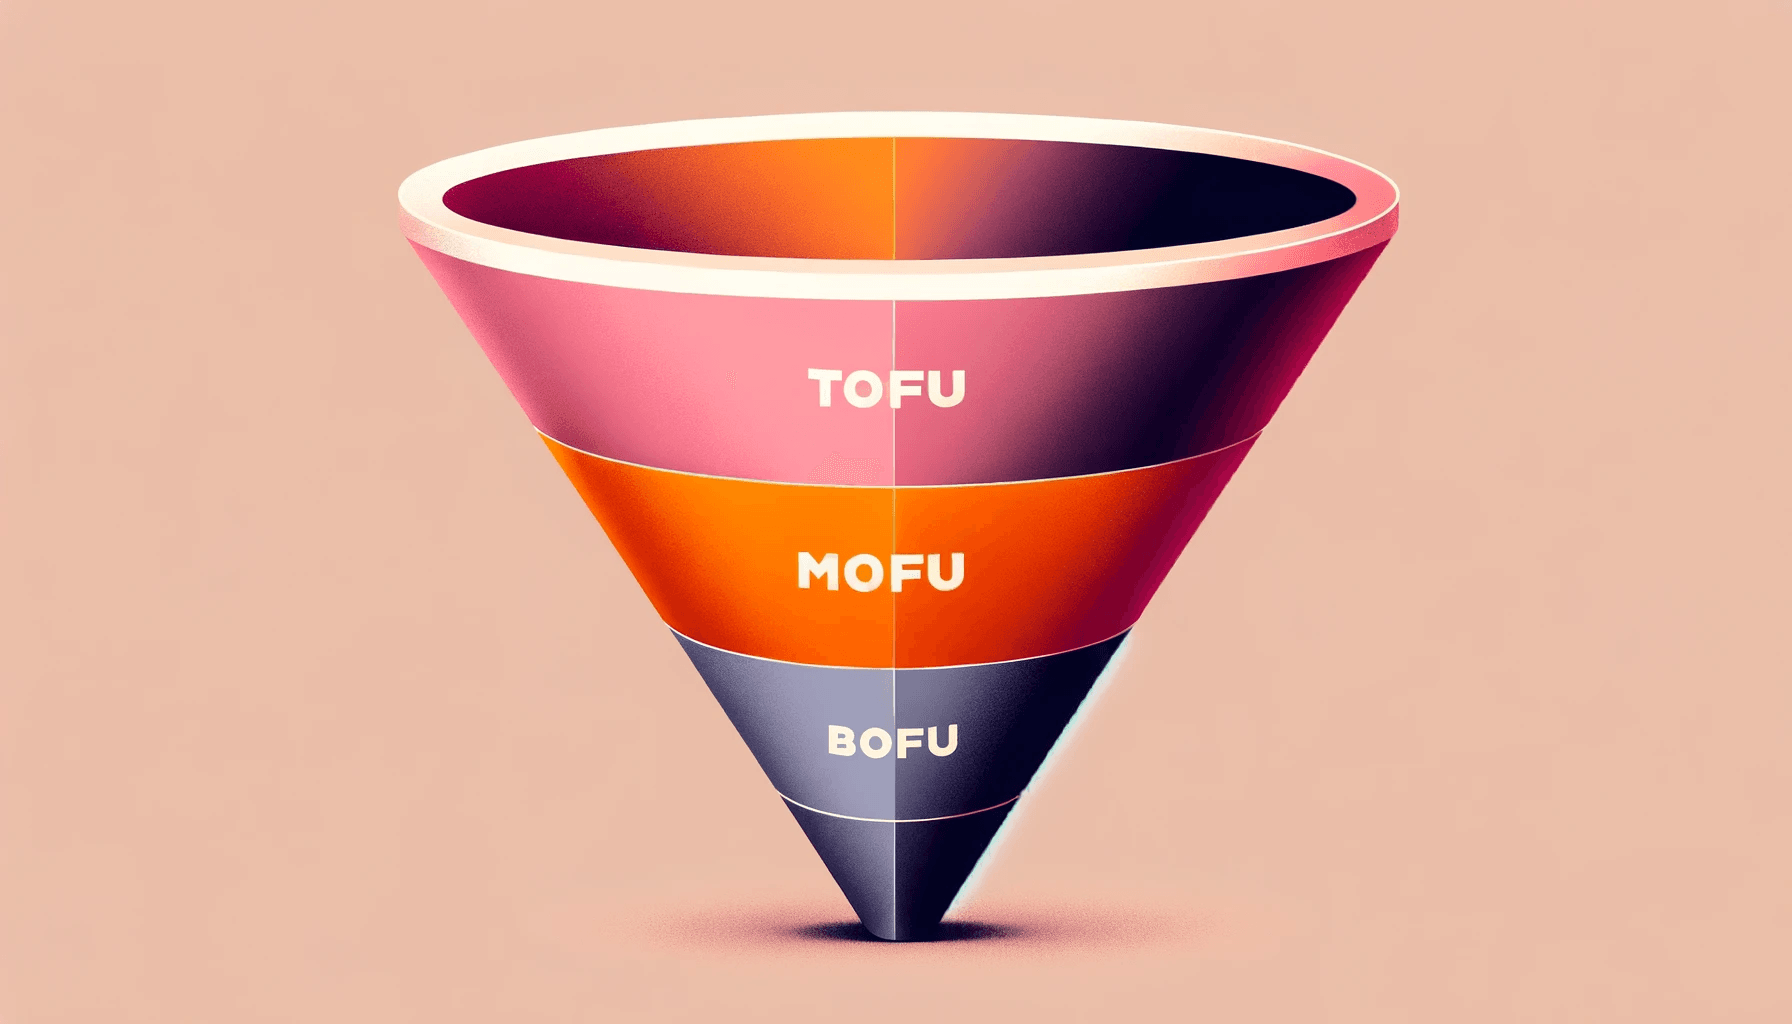
At the top-of-funnel (TOFU), your goal is to make a memorable first impression with your Instagram ad. Use eye-catching visuals and messages that resonate with your target audience's aspirations or pain points. The aim is to nurture interest and lead users smoothly down-funnel.
Optimizing your Instagram ad for upper-funnel is similar to CPM optimization. For the full step-by-step guide, click through to: How to lower your Facebook ads CPM.
Here is the TLDR of the linked blog post:
Lower CPM by improving Facebook's ad relevance diagnostics: Quality, Engagement Rate, and Conversion Rate Rankings.
Optimize audience targeting to reach the most relevant viewers and enhance ad performance.
Test ad variants to identify the most effective creatives for higher engagement and relevance.
Manage ad frequency to prevent fatigue and maintain a high engagement rate ranking.
Use social proof in ads to increase trust and engagement, positively impacting CPM.
Employ striking visuals to grab attention and improve the quality ranking.
5. Optimize your messaging and CTAs
The bottom of the funnel is where decisions are made. To optimize your Instagram ad to drive conversion post-click, your ads should be laser-focused on messaging, offers, and CTAs that drive CVR. That means ensuring your ad incorporates:
Clear, compelling calls-to-action (CTAs)
Offers that are too good to resist
Social proof
Bonus points if your ad communicates the solution to the pain point that your audience is experiencing.
It's about sealing the deal with those who are ready to commit. Here are some examples of high-performing Instagram and Facebook ads with stellar conversion rates:

These examples were pulled from our blog series The best Instagram and Facebook ads: The Addy Awards. We highly suggest you check them out and incorporate our AI-powered insights to optimize your Instagram ad for better conversions.
Optimize your ad with CVR-boosting insights
6. Align your ad and landing page for seamless user experience
Consistency is key. Ensure your Facebook and Instagram ads and their associated landing pages are in harmony, offering a fluid, intuitive transition for the user. The user’s expectations from the ad should be met with consistent messaging and visuals.
But you already knew that. So, let’s assume that you’ve already handled the high-level landing page optimizations (key messages and CTAs above the fold, no false bottoms, clear value propositions, and consistent messaging and CTAs).
What else can you do to optimize conversion rates?
Lead form conversion rate optimization
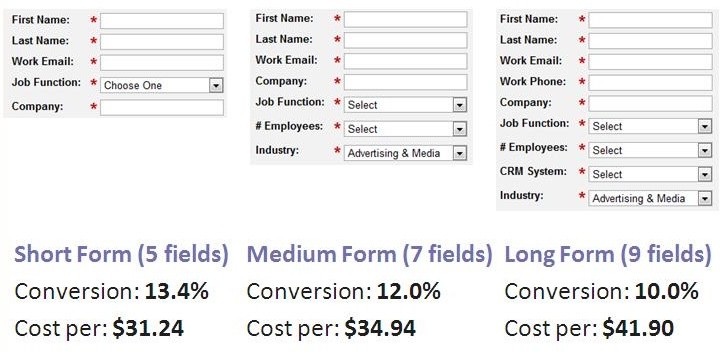
If your desired campaign conversion goal is a form submission, the rule of thumb is fewer fields result in higher conversion rates. VentureHarbour offers great data-backed insights on various aspects of forms. We encourage you to read their full blog post.
For now, here’s a quick summary of their findings:
Fewer fields generally result in better conversion rates
Removing the copy above the form results in better conversion rates
Multi-step forms that batch several questions into bite-sized chunks can drive more conversions
Offering an incentive to submit the form is a great way to drive conversions
Speak to your audience’s pain (points)
While your headline, subhead, and CTA may be compelling and memorable, there’s a chance your message isn’t quite resonating with your audience. Try tweaking your messaging to better speak to your audience, especially by addressing their pain points and offering the solution to their pain point.
The holy grail here is a copy that can frame the pain point in a way that also evokes an emotional response from the reader, it greatly enhances the chances of a successful conversion. In fact, RankTracker found a 28% increase in conversion rates through the use of copy that tapped into the reader’s emotions.
Here’s a simple formula for tapping your reader’s emotional core:
Frame the problem or pain point through the lens of your customer persona
Introduce your solution to their problem or pain point
Paint a picture of success for your persona through the use of your product
For example, this is a potential positioning statement for Ads Generator AI:
Now, we’re not saying you should put your positioning statement directly on your landing page. But a positioning statement built to the formula above can help you write more emotive copy.
Always keep your audience, their pain points, and how you solve that pain point in mind when writing landing page copy.
Embrace the whitespace
Cognitive load theory is a psychological principle that essentially explains why more information and distractions can hurt your conversion rate. What does this mean exactly?
It means you want to keep your landing page as clean as possible, while still communicating your brand or product’s value proposition and CTA. It may be tempting to cram as much information as possible into your landing page but keep in mind that much of that information can also distract your user away from converting.
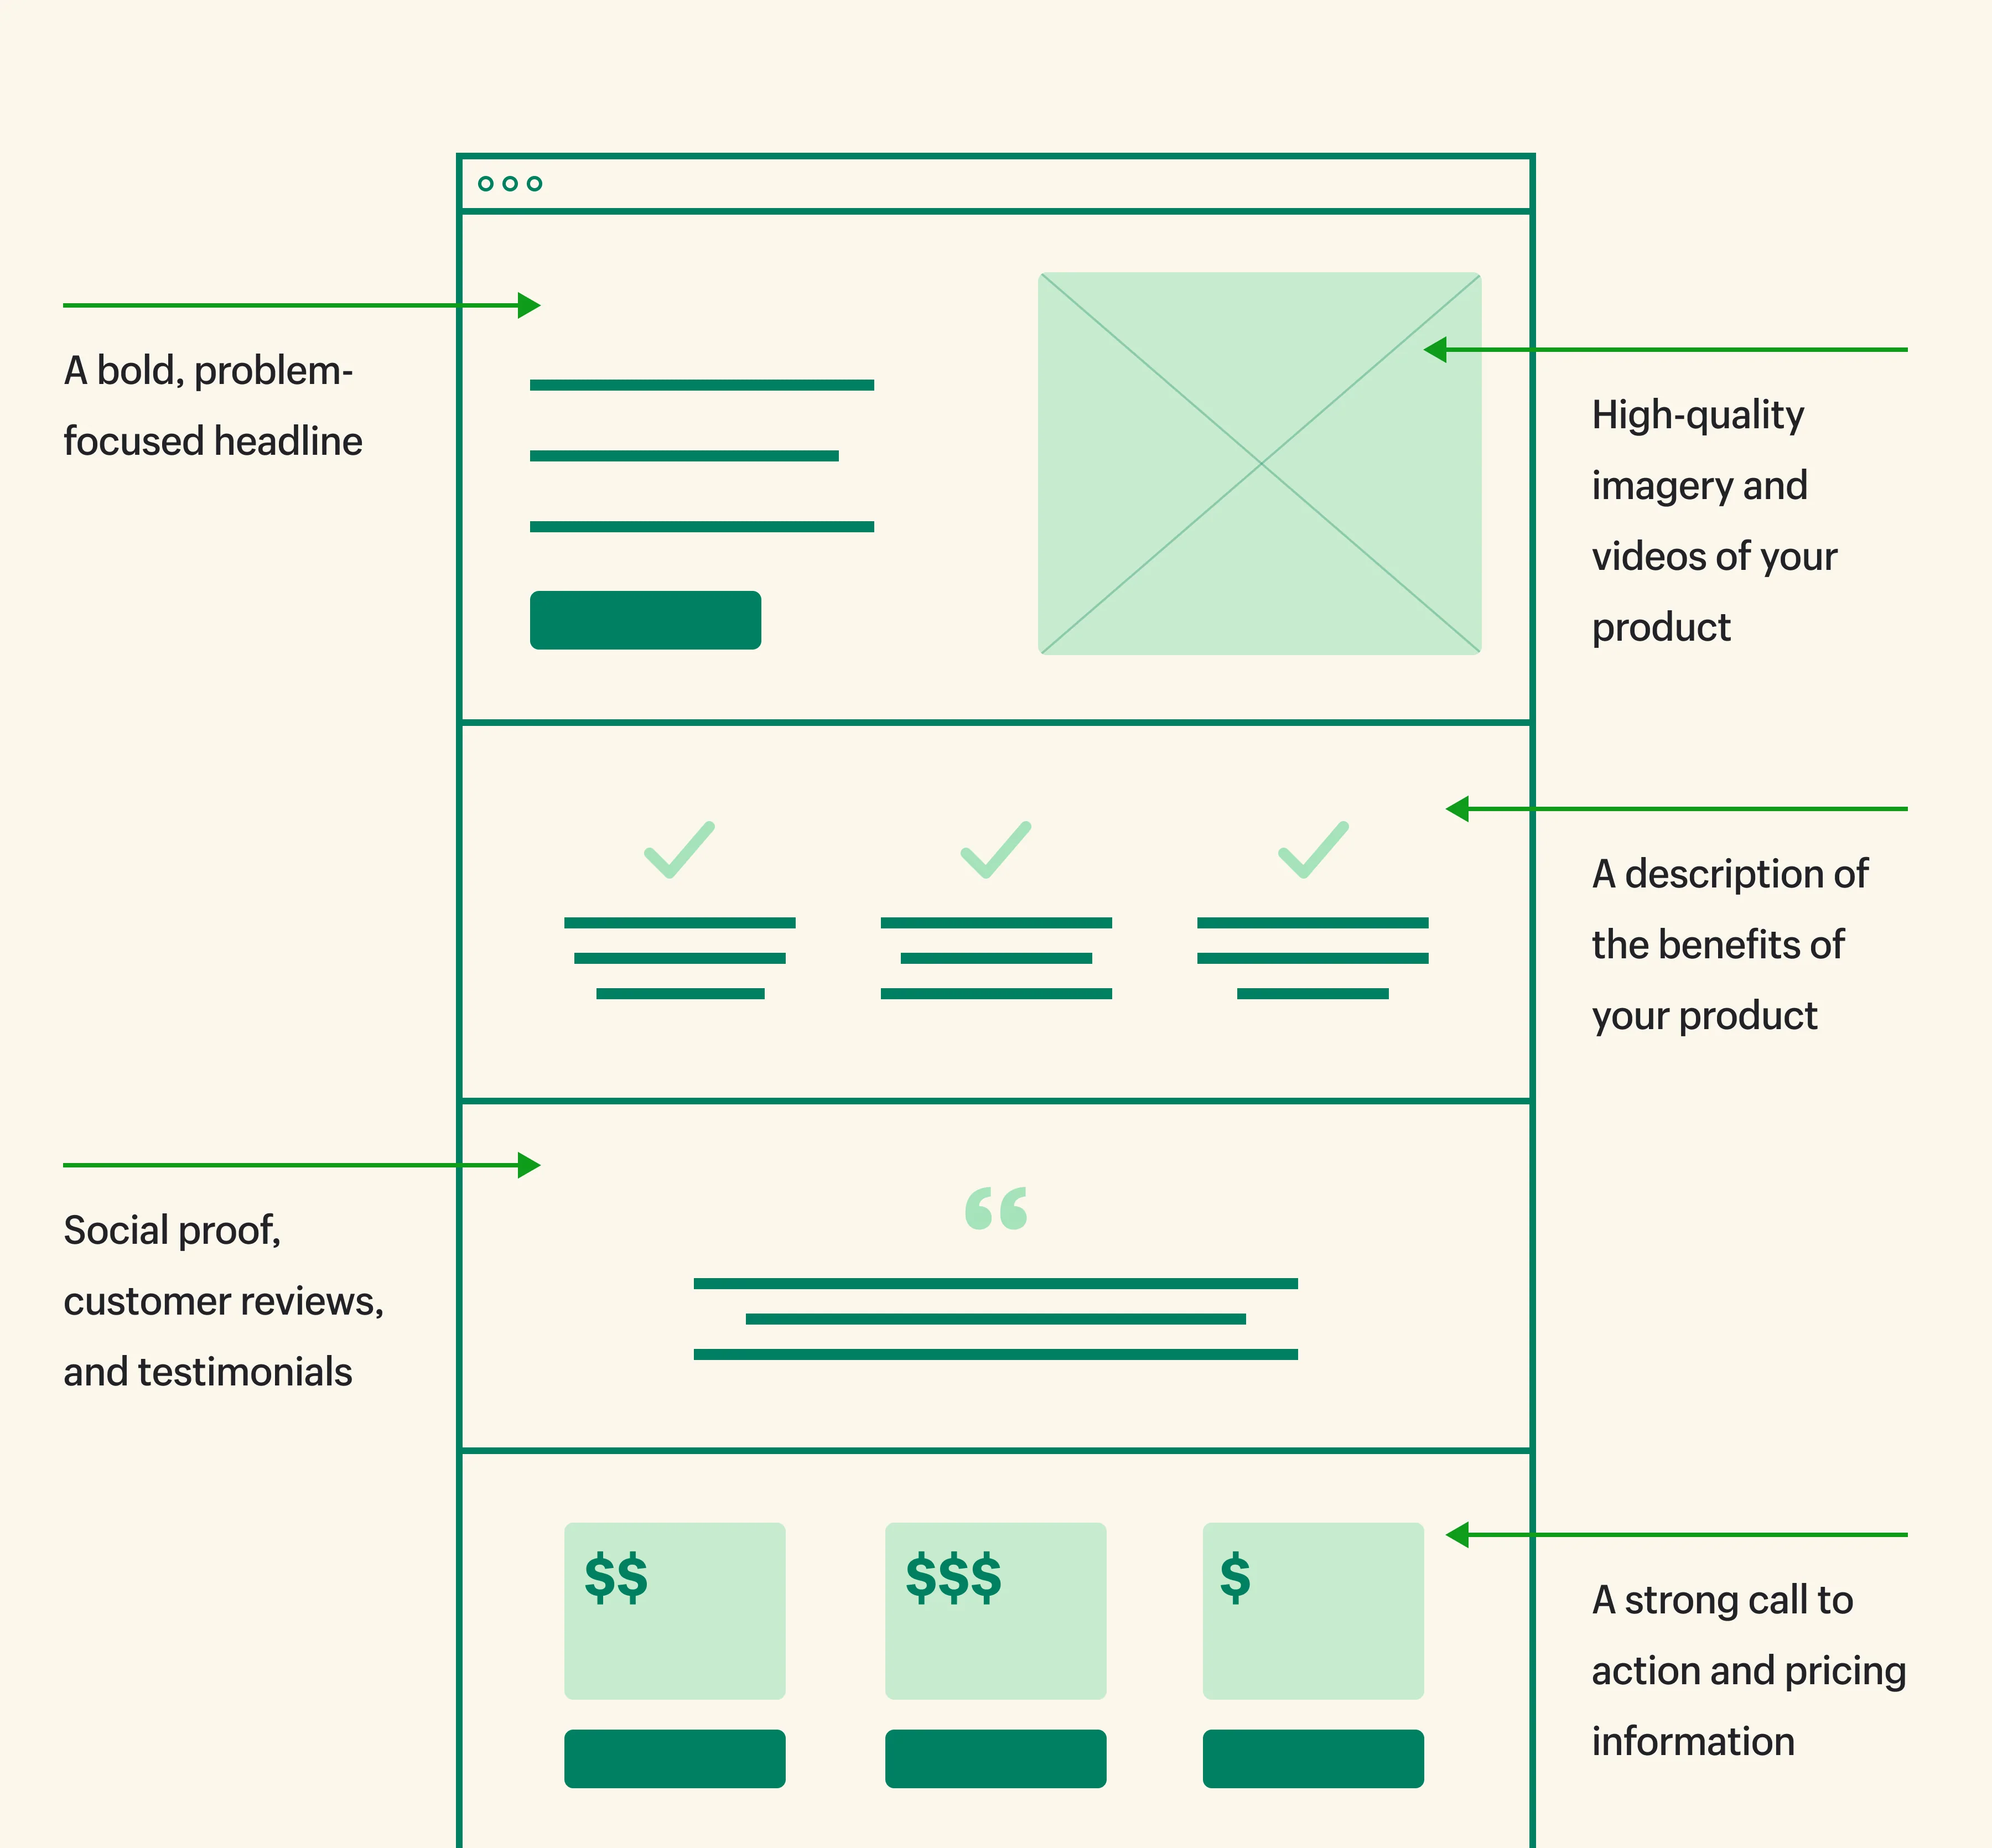
So, our top suggestion here is to lean into whitespace. A thoughtfully designed landing page with minimal copy and graphics can boost your conversion rate!
(Credit to Shopify for the landing page layout graphic above)
Prominently displayed social proof

Social proof refers to the idea of using customer testimonials, reviews, ratings, or user-generated content (etc.) that helps validate the usefulness of your product or brand. Putting social proof points on your landing page taps into a core psychological principle that also explains why FOMO (Fear Of Missing Out) is a thing.
According to Wikipedia, social proof is a psychological and social phenomenon amongst people who are unsure about a decision or how to act in a particular scenario. When the choice is unclear, the human brain pushes people to essentially copy the actions of others.
In this case, social proof can be the element of your landing page that pushes a user off the fence and into a conversion event.
The wholistic approach to improving your Instagram ad conversion rate
By now it should be obvious that your ad creatives and copies are only one piece of the puzzle that is your Instagram ad CVR. Embrace the strategies above to transform your Instagram ads into conversion machines.
Remember, improving your conversion rates is a journey of continuous optimization and connection with your audience. Dive deep into their desires and pain points, and tailor your campaigns to meet them where they are. With precision, creativity, and strategic insight, your ads will not only capture attention but convert it into profits!
Craft your winning ads